
简介
随着机房内的服务器和网络设备增加,日志管理和查询就成了让系统管理员头疼的事。
系统管理员遇到的常见问题如下
1、日常维护过程中不可能登录到每一台服务器和设备上去查看日志
2、网络设备上的存储空间有限,不可能存储日期太长的日志,而系统出现问题又有可能是很久以前发生的某些操作造成的
3、在某些非法侵入的情况下,侵入者一般都会清除本地日志,清除侵入痕迹
4、zabbix等监控系统无法代替日志管理,无法监控如系统登录、计划任务执行等项目。
基于上述原因,在当前的网络环境中搭建一台用于日志集中管理的Rsyslog日志服务器就显得十分有必要了。
Rsyslog服务的优点如下
1、Rsyslog服务器可以大多数的网络设备支持,在网络设备的系统设备选项中大多都有远程日志服务的配置选项。只需要填写上IP地址和端口(大多数设备已经默认是514了),然后确定就可以了
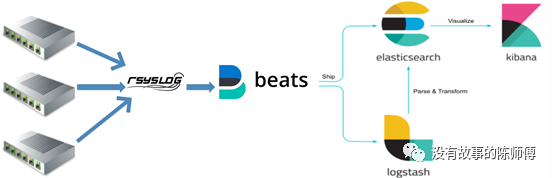
2、Linux服务器只需要在本地的Rsyslog服务配置中加入简单的一行就可以将日志发送到日志服务器,布署和配置起来十分简单;部署架构部署架构
架构
部署
服务端配置
编辑rsyslog配置文件:vim /etc/rsyslog.conf
配置如下:grep -v "^#" /etc/rsyslog.conf | grep -v "^$"
1 | $ModLoad imudp |
其中 “$ActionFileDefaultTemplate” 和“RSYSLOG_TraditionalFileFormat” 为使用默认timestamp格式
“$template” 为使用RemoteLogs模板接受客户端的日志,保存到本地的/data/logs/目录下,然后是每台客户端的ip_年份_月份_日期的log
“*.info;mail.none;authpriv.none;cron.none ?RemoteLogs” 如何设置为/var/log/messages,则自定义模板目录和message都会生成日志,如果只设置模板目录,则只会在模板目录生成
“*.* ?RemoteLogs” 为所有服务所有级别的日志都记录
“:fromhost-ip, !isequal, “127.0.0.1” ?RemoteLogs” 服务端本机的日志不记录
重启服务生效:systemctl restart rsyslog
可用的日志优先级:
| 编码 | 优先级 | 严重性 |
|---|---|---|
| 0 | emerg | 系统不可用。该日志消息将写入用户终端中。 |
| 1 | alert | 必须立即采取措施 |
| 2 | crit | 严重状况 |
| 3 | err | 非严重错误状况 |
| 4 | warning | 警告状况 |
| 5 | notice | 非常但重要的事情 |
| 6 | info | 信息性事件 |
| 7 | debug | 调试级别消息 |
客户端配置
Linux主机
编辑rsyslog配置文件:vim /etc/rsyslog.conf
1 | $ModLoad imfile |
交换机
华为交换机
进入系统视图模式:sys
配置发送源端口:info-center loghost source Vlanif 2
配置推送日志等级:info-center source default channel loghost debug level debugging
配置接收日志服务器:info-center loghost 192.168.1.200
思科交换机:
(config)#logging on
(config)#logging 192.168.99.50
(config)#logging facility local4
(config)#logging source-interface e0
Ruijie锐捷:logging buffered warnings
logging source interface VLAN 99
logging facility local6
logging server 192.168.99.50
Windows主机
Windows系统自带默认服务中并无发送syslog的配置功能。所以,需要借助工具来实现Windows系统发送syslog到日志服务器的场景
Windows系统发送syslog配置工具evtsys下载:
下载官方地址:https://code.google.com/archive/p/eventlog-to-syslog/downloads
evtsys工具配置:
下载好的安装包解压,把evtsys.exe拷贝到C:\windows\system32\evtsys.exe
打开cmd命令提示符,运行:evtsys.exe -i -h 192.168.1.200 -p 514
把evtsys安装成服务,-h后面跟日志服务器和端口
完成配置之后,启动evtsys服务:net start evtsys
ELK部署
Elasticsearch安装(本次使用8.10版本):
可以参考官网 https://www.elastic.co/guide/index.html
本次使用proxmox里面的lxc(类似于docker)的debain模板容器创建,使用apt方式安装,最大化利用资源
安装完毕会生成用户名和密码,用户名是elastic,密码是一串复杂的密码。
安装完后需要配置jvm占用,不然多大内存都不够用:vim /etc/elasticsearch/jvm.options
然后按说明启动即可,默认elasticsearch启动了https,访问https://ip:9200 输入用户名和密码,输出一下内容即成功:
1 | { |
如果忘记密码,可以通过/usr/share/elasticsearch/bin/elasticsearch-reset-password -u elastic重新生成。
Kibana安装
同样使用官网安装方式,此时已经添加上了elasticsearch的repo,可以直接使用apt install -y kibana来安装
安装完毕后修改/etc/kibana/kibana.yml,填上适当的地址即可,然后启动
访问http://ip:5601,输入elasticsearch的用户名和密码登录,此时初始配置需要输入enrollment-token,由elasticsearch生成:/usr/share/elasticsearch/bin/elasticsearch-create-enrollment-token -s kibana
复制生成的码到窗口即可
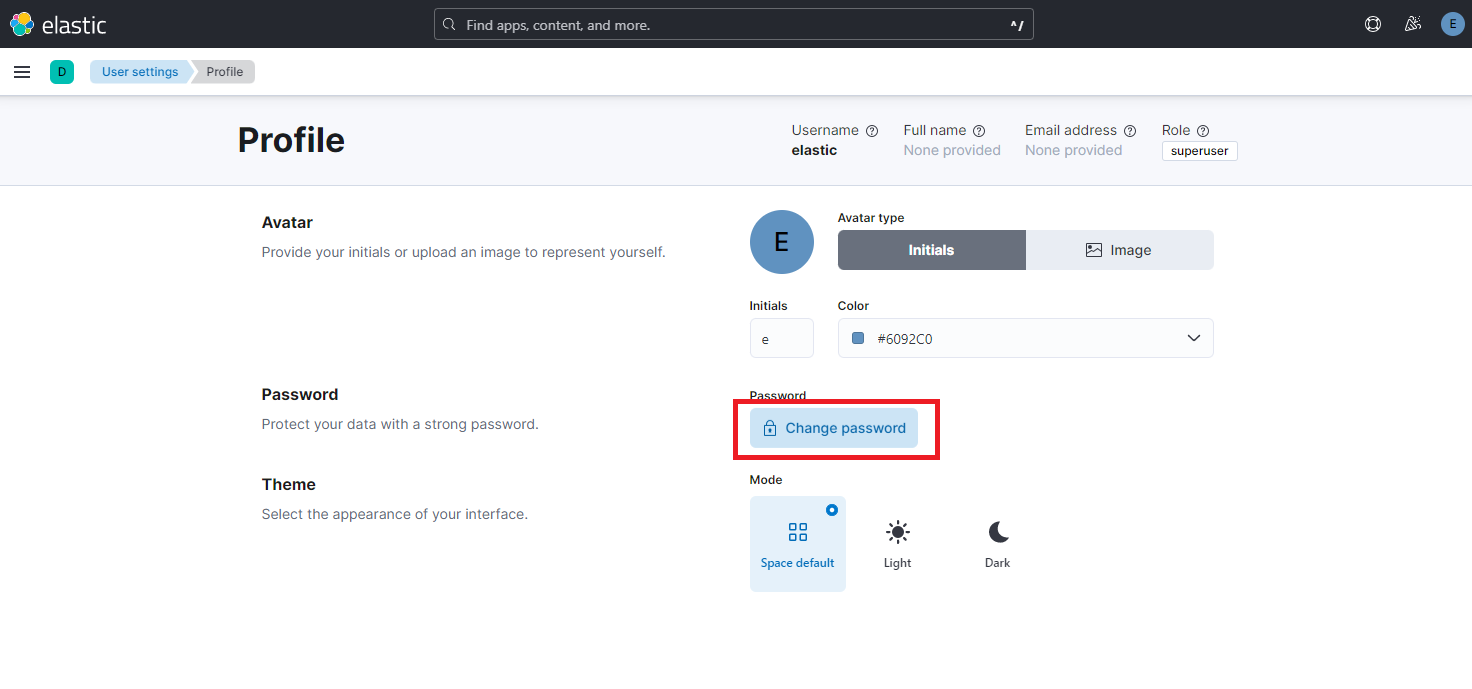
进入kibana界面后,可以通过界面右上角点开profile来修改密码,相当于同时修改了elasticsearch的密码
filebeat安装
在rsyslog服务器上,使用官网下载的二进制文件,不用安装,直接运行
配置filebeat.yml
1 | filebeat.inputs: |
运行配置文件检查:./filebeat test config
Config OK
测试连接和输出:./filebeat test output
1 | elasticsearch: https://192.168.1.150:9200... |
如果配置文件不加ssl.verification_mode: none,则会报错,因为没有配置证书进行通信
启动filebeat查看输出:./filebeat -e -d publish
此时回kibana界面,可以看到有filebeat-*开头的索引,即成功输出。